Marketing Mix Modeling, Media Mix Modeling, Marketing Effectiveness, Experimentation, Causal Inference, Adstock, Marketing ROI, Statistics, Machine Learning, Marketing Attribution, Media Planning, Marketing Budget Optimization, Robyn, Multi touch Attribution, First Party Data, Privacy Proof Marketing Solutions.

Blogs

How we build robust MMM models with help of Bootstrapping

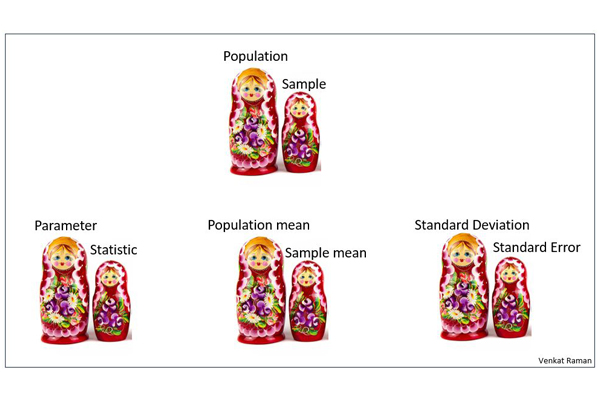
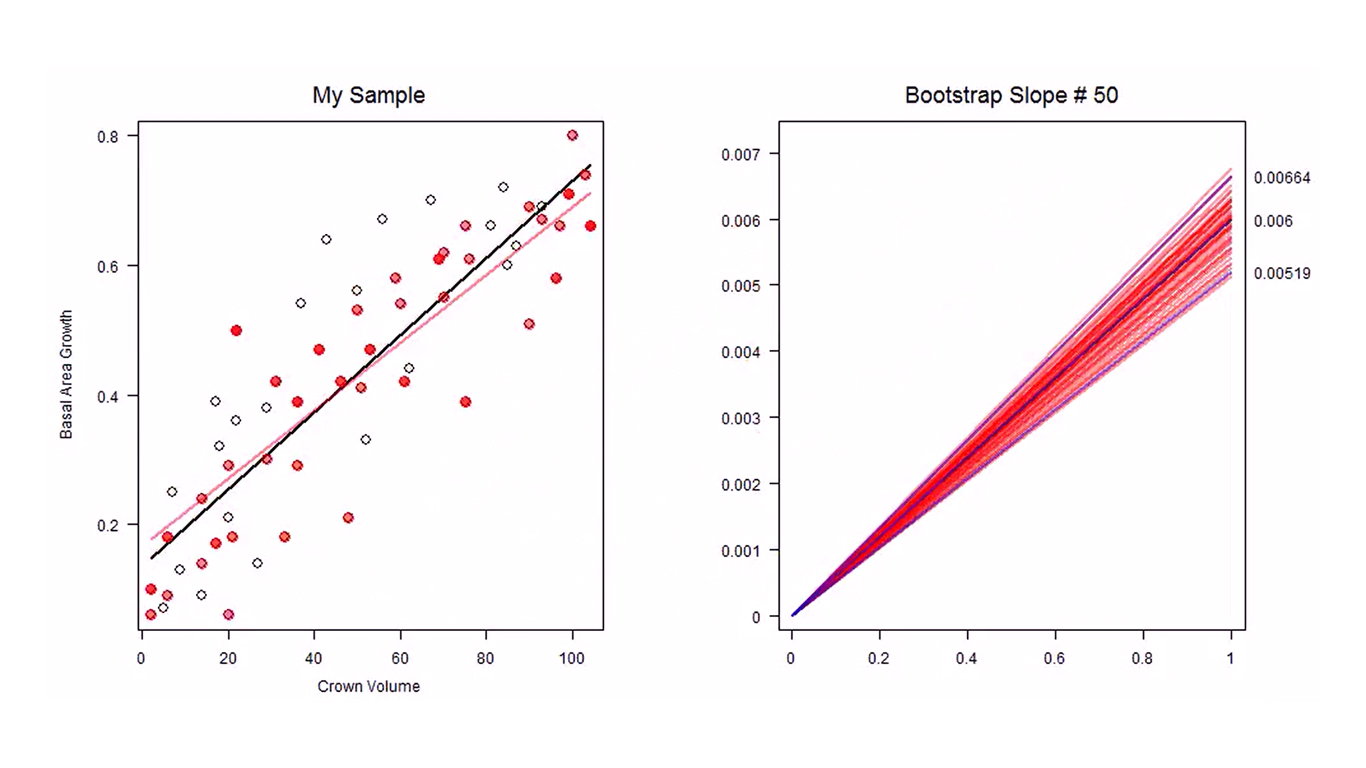
In statistics, especially inferential statistics, the corner stone paradigm is that of sample-population. We most often don’t have the population details. We hence try to infer things about the population through the sample. For e.g. Population parameter is estimated through sample statistic. ▪ What is Bootstrapping? Bootstrapping simply put is a method of repeated sampling (with replacement) of a sample. The sample chosen is assumed to be a good representation of the population. ▪ What is the utility of Bootstrapping? Bootstrapping should be seen as a method to learn about the sampling distribution rather than a method to estimate the population parameter. If we take simple linear regression as example,

Read More »

Bayesian MMM and The Richard McElreath’s Quartet

A week ago, I talked about epistemic uncertainty in Bayesian framework as a result of uninformative priors. That post drew expected reactions and many of Bayesian loyalists provided only hand wavy refutations. ICYMI the link to post is in comments. Anyhow, I stumbled upon an interesting tweet from Richard McElreath. I have named it ‘Richard McElreath’s Quartet’ much like the Anscombe’s quartet. What is this Richard McElreath’s Quartet? Richard McElreath begins his post by saying “Don’t trust intuition, for even simple prior + likelihood scenarios defy it”. This point is very fundamental and I will link it back to Bayesian MMM later in the post. But to stay on point

Read More »

The Problem of priors in Bayesian MMM

In any data science project, the biggest hurdle is translating the business problem into a statistics/ML problem. Lot of things gets lost in this translation which eventually leads to inaccurate models and unhappy customers. In MMM, especially Bayesian MMM, this ‘lost in translation’ problem is more pronounced. The client is sold the magic that through Bayesian MMM they can encode their prior beliefs into the model. But in my experience, to encode prior beliefs one needs really good grasp on probability distributions. Even trained statisticians find it challenging to convert “Hey I feel the marketing channel xyz’s ROI should be around 2.3” into a particular probability distribution. Because many don’t

Read More »

Why Rows > Columns in MMM

If your job involves dealing with tabular data, then it is always prudent to ask for more data (rows) rather than ask for more features (columns). There is no point in having more columns which are shallow (i.e. missing data). We at Aryma Labs deal with tabular data a lot, especially in the form Marketing Mix Model (MMM) data. Whenever client provides us data and asks the question “Are the data enough or should we get more features?” We always ask them if they can provide more rows than columns. Statistically speaking too, having more rows is better because the chances of you estimating the coefficients with less bias is

Read More »

Why Heteroscedasticity matters in Marketing Mix Modeling (MMM)

MMM is something that always leads you to reminisce about the learning one had or hadn’t during their statistics course. 15 years ago, when I was a student, I attended one statistics seminar. In it the professor told “Always be testing your assumptions”. That statement rings true even now, especially in MMM. In MMM, inference is the name of the game. In inference, one deeply cares about the preciseness and un-biasedness of the regression coefficients. So the question arises, what can throw a spanner at your inference? Heteroscedasticity is one of the culprits. 📌 But what exactly is Heteroscedasticity? Can you simply eye ball it from your data? One of the

Read More »

Moments – Statistics’ physics connection

Interesting Fact: Imagine you sculpted your distribution out of wood and tried to balance it on your finger. The balance point would be the mean regardless of the shape of the distribution !! Now why is that? This is where the concept of Moments come into play. Many of you might be wondering, how did the physics concept of ‘Moments’ came into statistics. Well, statistics has a physics connection. 😅 Moments are the expected value of a Random variable. Moments define the characteristics and shape of a probability distribution. Typically Moments about origin are called ‘Raw Moments’ and those around the mean are called ‘Central Moments’. In fact, Mean is

Read More »

Seeing Statistical Tests through the lens of Signal vs Noise

Seeing Statistical Tests through the lens of Signal vs Noise. Most statistical tests are designed to discern signal from the noise. Let me take a classic example – ANOVA The F test for one way ANOVA is given as follows: F= Variance between treatments / Variance within treatments. One could look at the numerator as the signal and the denominator as the noise. But why is the denominator ‘variance within treatments’ noise ? Lets take a small example. Imagine you have 4 schools A, B, C, D and the heights of 5th grade students in all the 4 schools. You have a hypothesis that there is a difference in heights

Read More »

A high t statistic does not indicate strong relationship between dependent variable and Independent variable

Gentle Reminder : A high t statistic does not indicate strong relationship of IVs with the DV. Just the other day, I saw a post (again) stating that a t statistic indicates strength of relationship of IVs to DVs. So here is a gentle reminder (sharing it again). The high t statistic here does not indicate a strong relationship with the dependent variable. We must first understand what is the null hypothesis in the current context. The null hypothesis is slope =0 or in other words the beta = 0. The alternate hypothesis being, slope ≠0. So even if we reject the null, we still don’t get ‘quantification of the

Read More »

How a statistical technique that helped solve German Tank problem during WW2 is helping us get accurate attribution in Marketing Mix Modeling (MMM)

When we talk about application of statistics during world war 2, somehow the image of the airplane with red dots (survivorship bias) comes to mind. Don’t worry I am not going delve on that again 😅 There are however other lesser known statistical applications during world war 2 which had a huge impact in the outcome of the war. One such application is in the ‘German Tank problem’. The ‘German Tank Problem’ is basically about statistical theory of estimation. Estimating population based on sample is nothin new, but the innovative application in the German tank problem is something to really learn about. The problem is about estimating the number of

Read More »

What does ‘statistic’ in statistics mean?

Are you confused about the meaning of ‘statistic’ in statistics? You’re not alone. Many blogs and posts on the internet use the term loosely. In statistics, a statistic is defined at a sample level, whereas a parameter is defined at a population level. To estimate the parameter, we use a statistic. One of the mental models that I use to get these concepts right is to think of these concepts in the form of Matryoshka dolls (a.k.a Russian nested dolls). Please note that barring the first doll (Population and sample), I don’t intend to showcase them in a way that one is smaller than the other. Rather I would want

Read More »
Scroll to Top