Seeing Statistical Tests through the lens of Signal vs Noise.
Most statistical tests are designed to discern signal from the noise.
Let me take a classic example – ANOVA
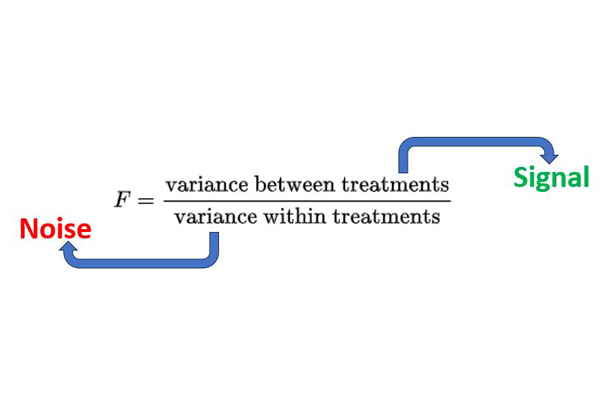
The F test for one way ANOVA is given as follows:
F= Variance between treatments / Variance within treatments.
One could look at the numerator as the signal and the denominator as the noise.
But why is the denominator ‘variance within treatments’ noise ?
Lets take a small example.
Imagine you have 4 schools A, B, C, D and the heights of 5th grade students in all the 4 schools.
You have a hypothesis that there is a difference in heights of 5th grade students across the schools.
So you start collecting data of 5th grade students from schools A, B, C and D.
You notice that there is slight variations in heights of 5th grade students within a school itself. Something like 3.7ft, 3.8ft..4.2ft.
This is the within-subjects variance.
You see when our goal is to discern whether there is a significant difference in the heights of 5th grade students across the schools, the within school variance becomes an impediment.
Say your between subject variance was 5 and within subject variance was also 5. You get a ratio of 1. There is not a lot of signal coming out.
But imagine a between subject variance was 5 and within subject variance was 2. You get a ratio of 2.5.
So you can say a given school is 2.5x times different than other schools.
Because ANOVA is omnibus test you wont know where the difference between the groups are. You will have to conduct a post hoc test.
So overall, it is always about mitigating noise to enhance the signal.
You can find this signal vs noise duel in most of the statistical tests. Example goodness of fit measures like R squared value, Power of a test etc.
If you are interested, link to my other posts on ANOVA are provided in resources.
Resources:
Why was ANOVA invented: https://www.linkedin.com/posts/venkat-raman-analytics_statistics-datascience-datascientists-activity-7052176867046420480-2BUC?utm_source=share&utm_medium=member_desktop
How useful is F test in Linear Regression? https://www.linkedin.com/posts/venkat-raman-analytics_statistics-datascience-datascientists-activity-7053981090830594048-COe0?utm_source=share&utm_medium=member_desktop
Mean vs Conditional Mean : https://www.linkedin.com/posts/venkat-raman-analytics_statistics-linearregression-datascience-activity-7054704578205806592-YWXC?utm_source=share&utm_medium=member_desktop