Technically the right answer is – It depends.
But there are also a lot of heuristics and rule of thumb on how much data is adequate.
Statistically speaking we need to have enough degrees of freedom to estimate the parameters.
When one has more predictors than data, we call it the P>N problem. In this case, you have more predictors and there isn’t simply enough data to estimate the parameters of these predictors.
📌 The 1 in 10 rule
One thumb rule people resort to is the 1 in 10 rule. Basically it says that for every 1 variable we need to have 10 observations.
It isn’t clear how or why this rule of thumb came about.
But through our research we think that the reason for setting 1 in 10 rule is much more than just ensuring enough degrees of freedom to estimate the parameters.
What is that reason?
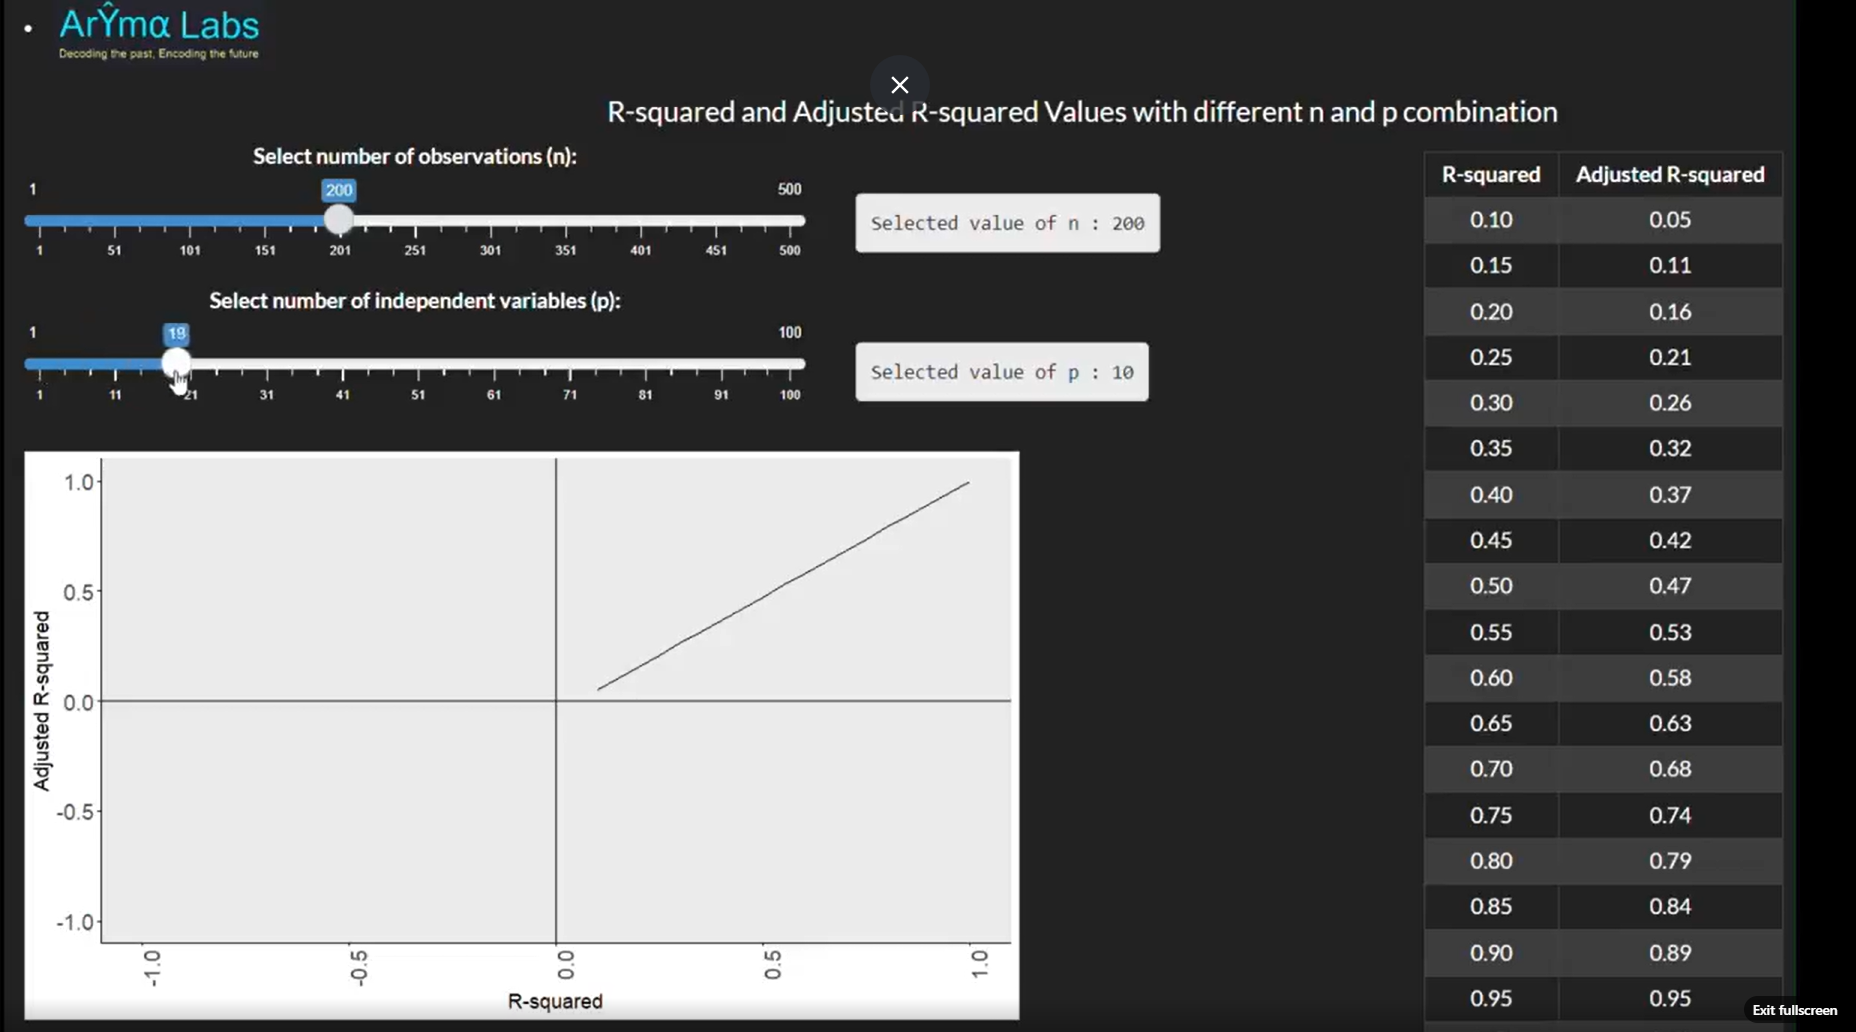
📌 R squared and Adj R squared value.
R squared is a goodness of fit measure. But if you keep adding more variables the R squared value will go up, regardless of if the variable was really statistically significant in explanting the change in the Dependent variable.
So Adj R squared value is also reported. Basically Adj R squared, if you look at the formula [1-(1-R^2)(n-1/n-p-1) [Sorry Linkedin doesn’t allow LATEX)] penalizes addition of extra variables. The value of Adj R square only increases if the variable included is meaningful in explaining the Dependent variable.
📌 Shiny App Illustration
In this shiny app example, we tweak and experiment with various N (number of data points) and P (predictors) to see its corresponding change in R square and Adj R square value.
I have written in my earlier post (link in resources) that at the very start, one should not fixate on having high R square and Adj R squared value.
But R squared value do provide a lot of information about the goodness of fit (if one does not go crazy with including many predictors).
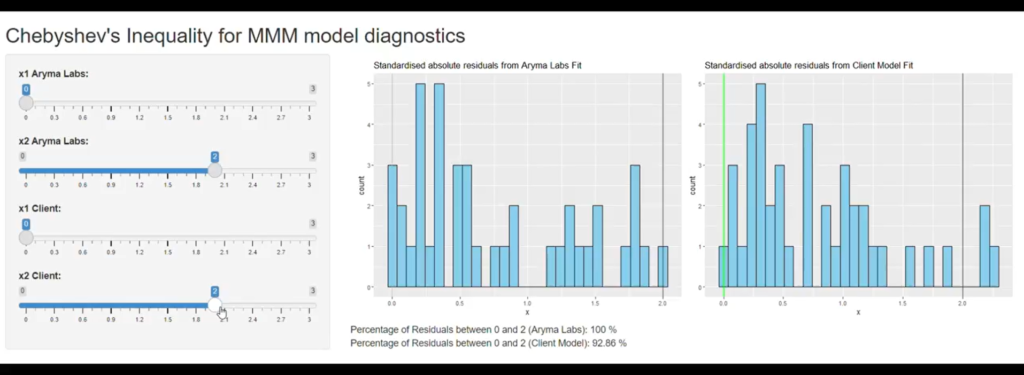
In our MMM work, we often come across cases where clients lament that the model built by earlier vendor or their own DIY model had negative adj R square value but the corresponding R square was positive.
Firstly R square and Adj R square are functions of the data. So predominantly the negative adj R squared value is more due to inclusion of large number of poor predictor variables.
But this app demonstrates that even if you have moderate or bad data, having more data for every variable can technically get you a positive adj R squared value !!
📌 Summary:
The 1 in 10 rule is a rule of thumb at best. While it may seem to solve the problem of negative adj R squared, your underlying problem of achieving goodness of fit will still remain if your variables are poor predictors/explainers of the dependent variable.
So focus on data quality, and 1 in 10 rule is not an absolute must. We consistently build good models with 52-104 weeks of data or 36 months of data while having 15-20 variables.
Resources:
Why customers should not expect their Marketing Mix Models (MMM) to have very high R squared value
https://bit.ly/41Cr5h3