Do you use the right tools to evaluate your MMM model?
Having the right tools to measure your MMM model’s accuracy is as important as specifying the model correctly.
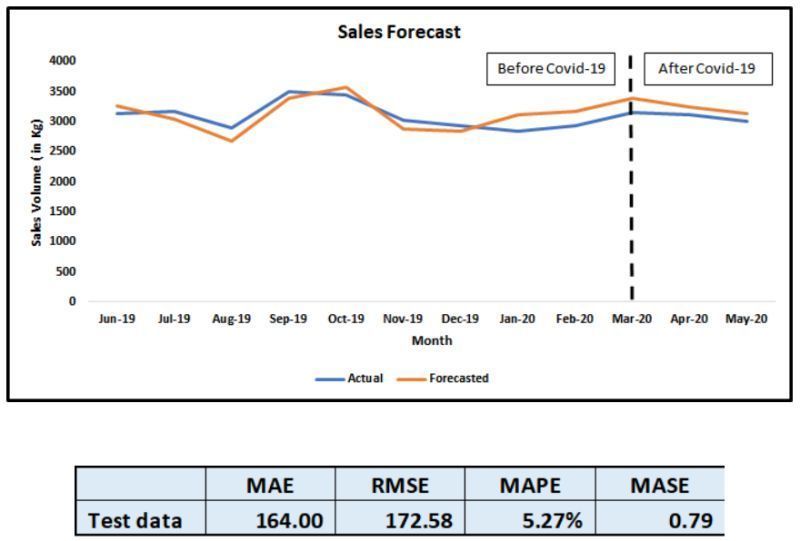
Contrary to popular belief, MMM is just not about retrodiction. If the model is well specified, it can also be used for forecasting (for a reasonable future period). This comes handy in media planning and marketing budget planning.
Forecasting is also about picking the right accuracy metric.
Here are some pointers that may help you to choose between MAPE and RMSE.
MAPE – They cannot be used for intermittent patterns where the observed value (e.g. demand) becomes 0.
RMSE – RMSE penalizes larger errors more as compared to smaller errors. If the business need is to flag large anomalies quickly and
efficiently, then RMSE could be picked.
🚩 Important Note: When comparing model iterations for the same model, different accuracy metrics shouldn’t be compared to each other.
For e.g.
Iteration A – MAPE should be compared against Iteration B –
MAPE only and not against say RMSE of Iteration of B.
============================================
Since we talked about penalizing errors in RMSE, this gives rise to the topic of symmetric and Asymmetric.
Is MAPE Symmetric and Asymmetric?
Asymmetric MAPE puts heavier penalty on negative error.
Consider the following e.g.
Scenario 1:
APE = ((|Actual – Forecast|)/|Actual|)*100
If Actual = 150, Forecast = 100
APE = 33.33%
But if, Actual = 100, Forecast = 150
APE = 50%
In the first case, the error is +ve. In the second case when the error is -ve i.e. Actual < Forecast, the APE is higher.
Note in scenario 1,the difference between the Actual and Forecast value is constant i.e., the magnitude of the error is constant for both the examples.
Scenario 2:
If Actual = 100, Forecast = 90
APE = 10%
If Actual = 100, Forecast = 110
APE = 10%
In Scenario 2, both +ve and -ve errors are considered but the APE remains same.
So, on a percentage scale MAPE is symmetric but when the actual value changes and the magnitude of the error is constant (in Scenario 1) it looks asymmetric.
P.S: For more detailed comparison of MAD, MASE, RMSE against MAPE, check out my detailed article (Link under resources).
Resources:
MAD over MAPE : When to use which accuracy metric (https://towardsdatascience.com/mad-over-mape-a86a8d831447?source=friends_link&sk=f7f79e86db48e00810b3dfc8c8e98494)